
The average Medway home sold for £296,182 in June 2026 (Land Registry), up 1.1% in a year. Prices by type, and why Rochester costs £50k more than Chatham.
Whether you own a home in the Medway towns or you are trying to buy one, the question is the same: what are houses here actually worth right now? Asking prices in agents’ windows tell you what sellers hope for. The figure that matters is what homes genuinely change hands for, and that is recorded by HM Land Registry once every sale completes. This is a plain read of those numbers for 2026: the average price, which way it is moving, what you pay for each property type, how Rochester, Gillingham and Chatham compare, and how Medway sits against Kent and England.
The headline figure for 2026
The average home in Medway sold for £296,182 in June 2026. That is the provisional figure from the official UK House Price Index, which is built from completed Land Registry sales rather than asking prices.
Prices were up 1.1% over the twelve months to June 2026, a rise of £3,259. That is slower than the county: Kent was up 2.1% over the same year and England up 1.8%, while the South East as a whole managed only 0.3%. It is also less of a recovery than it looks. Medway’s average peaked in January 2023 at £302,237, so June 2026 is still £6,055 below the high water mark, 41 months later. Flats are the weak spot, down 1.5% on the year and 7.1% below their own 2023 peak.
A note on the numbers you will see elsewhere. Rightmove’s Medway sold-price page shows an average of about £339,000 for the past year, from the same Land Registry sales. That is not a contradiction. Rightmove’s figure is a simple average of whatever happened to sell, so a run of detached sales drags it up; the official index adjusts for the mix of properties so months can be compared fairly. Both are real. Just check which method a figure uses before you compare it with another.
What it means for you
If you are selling, the market is price-sensitive: the borough average is still below where it stood in January 2023, so realistic pricing from the start tends to sell while chasing a 2022 figure tends to sit. If you are buying, Medway is rising more slowly than Kent as a whole, which is a little negotiating room you do not get in most of the county, and flats are cheaper than they were a year ago. It is worth checking the council tax band of any home you view, since that yearly bill is a running cost many buyers overlook. If you are staying put, your home is worth about £3,000 more in cash terms than a year ago, which after inflation is close to standing still.
Prices by property type
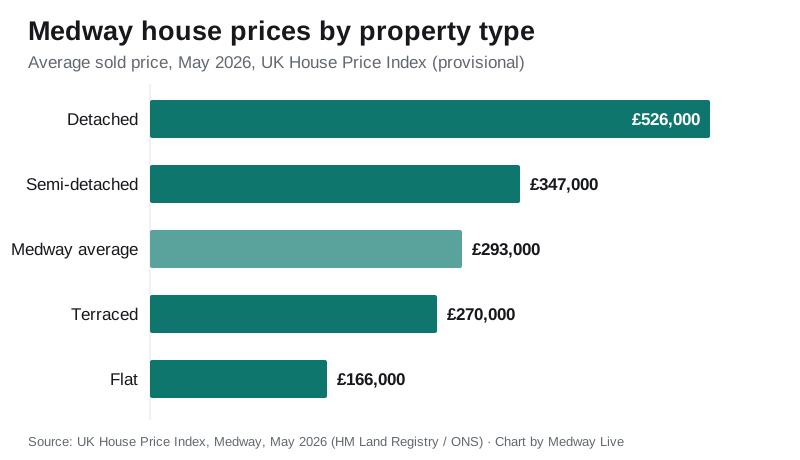
The headline average hides a wide spread. These are the Medway averages for June 2026 from the UK House Price Index:
- Detached houses: £531,901, up 0.1% on the year. The top of the local market, mostly on the fringes and the newer estates.
- Semi-detached houses: £351,457, up 1.7%. The classic Medway family move, and one of the two types carrying the market.
- Terraced houses: £273,509, up 1.8%, the fastest riser. The backbone of the five towns’ Victorian streets and the most common way into a house.
- Flats and maisonettes: £167,976, down 1.5%. The cheapest way in, and the only type still falling; flat buyers are the most exposed to mortgage costs.
First-time buyers and home movers
The same data splits buyers usefully. A first-time buyer in Medway paid an average of £268,519 in June 2026, up 1.4% on a year earlier. A home mover, someone selling one property to buy another, paid an average of £345,668, up 0.8%. The roughly £77,000 gap between the two is, in effect, the size of the step up from a first flat or terrace to a family house in the Medway towns.
Rochester, Gillingham or Chatham: what the towns cost
Medway is five towns with five markets, and the gaps between them are consistent. Comparing average sold prices across the three biggest towns, Medway Property News put Rochester at £342,000, Gillingham at £303,000 and Chatham at £290,000, a spread of about £50,000 between the dearest and cheapest for broadly similar property.
Rochester carries the premium you would expect from the castle, the cathedral, the high street and the fastest trains to London; a 2026 buyers’ analysis by a local agent puts typical Rochester and Strood family homes in the £325,000 to £400,000 range, Gillingham at £300,000 to £350,000 and Chatham at £250,000 to £300,000 (CR Real Estate). Chatham’s discount is exactly why it attracts first-time buyers and landlords, while Rainham and the Hoo villages trade on schools and space rather than a station.
The extremes make the point. Over the past year Rochester’s biggest ordinary residential sale was Vines Croft on Crow Lane, a Grade II listed four-bedroom semi by the castle, at £975,000, while the cheapest was a two-bedroom converted flat on the High Street at £81,500 (Medway Property News). A twelve-fold spread inside one town is why any single “Medway average” needs the detail underneath it.
How Medway compares to Kent and England
Medway has long been the affordable corner of the county, and the current index shows it clearly.
| Area | Average price | Annual change |
|---|---|---|
| Medway | £296,182 | +1.1% |
| Kent county | £346,118 | +2.1% |
| South East region | £380,380 | +0.3% |
| England | £293,262 | +1.8% |
All figures from the UK House Price Index, June 2026, provisional.
In plain terms, the average Medway home costs about £50,000 less than the typical home in Kent and £84,198 less than the South East average, while sitting about £2,900 above the England average. Only Thanet is cheaper among Kent’s thirteen local authority areas. That affordability, an hour’s high-speed train from London, is the engine of the local market: it is what keeps drawing London and Kent movers in.
Frequently asked questions
What is the average house price in Medway?
The average home in Medway sold for £296,182 in June 2026, according to the provisional UK House Price Index built from HM Land Registry sales. That covers all property types across the unitary authority, from Strood to Rainham and the Hoo Peninsula.
Are Medway house prices going up or down in 2026?
Slightly up. Prices rose 1.1% in the year to June 2026, against 2.1% across Kent. Terraces rose fastest at 1.8%; flats were the only type to fall, down 1.5%. The borough average is still £6,055 below its January 2023 peak.
Which is the most expensive Medway town?
Rochester, at around £342,000 on average, against about £303,000 in Gillingham and £290,000 in Chatham (Medway Property News). Chatham is the cheapest of the five towns and the usual first-time-buyer entry point.
How much is a detached house in Medway?
A detached house averaged £531,901 in June 2026, roughly £180,000 more than a semi-detached at £351,457. Terraces averaged £273,509 and flats £167,976.
Is Medway cheaper than the rest of Kent?
Yes. The Medway average of £296,182 is about £50,000 below the Kent county average of £346,118 on the same index, and £84,198 below the South East average. Only Thanet is cheaper in Kent.
Where can I check what a specific house sold for?
Every completed sale in England and Wales is public. Look up any street or address free on the HM Land Registry Price Paid service, or browse the same data on Rightmove and Zoopla.
Sources
- UK House Price Index, Medway (ONS / HM Land Registry) for the Medway average, annual change and buyer-type figures.
- UK House Price Index data browser, Medway, June 2026 for the property-type averages, and the same browser for the Kent and South East comparisons.
- UK HPI full file for June 2026 for the Kent, South East and England comparisons and the January 2023 peak.
- Rightmove Medway sold prices for the simple sales-average contrast.
- Medway Property News, Gillingham, Chatham and Rochester compared and Rochester’s cheapest and most expensive sales for the town-by-town picture.
- CR Real Estate, best areas to buy in Medway 2026 for typical town price ranges.
- HM Land Registry Price Paid search to check any individual address.
If you are weighing up a move within the towns, the pages worth reading alongside this one are what your council tax band will cost, the trains to London from each station and where to park. More Medway information is on the Medway Live home page.
June 2026 figures are provisional and are revised as more sales complete; the July index is published at 9.30am on 16 September 2026. Our news story on this release has the full Kent comparison. Always confirm the latest numbers against the linked HM Land Registry sources before making a decision. Last updated 22 August 2026.
Have your say